> ## Documentation Index
> Fetch the complete documentation index at: https://docs.usedaymark.io/llms.txt
> Use this file to discover all available pages before exploring further.
# Quickstart
> Understand how Daymark works and follow a simple path to your first AI-powered insight.
## What to know before you start
Prepare at least one data source: Google Sheets, a CSV file, or a PostgreSQL database. Daymark will pull data from these data sources.
You can start with a specific business question, or use Daymark’s starter questions to explore your data right away.
Follow the steps below inside your workspace to reach your first usable insight.
***
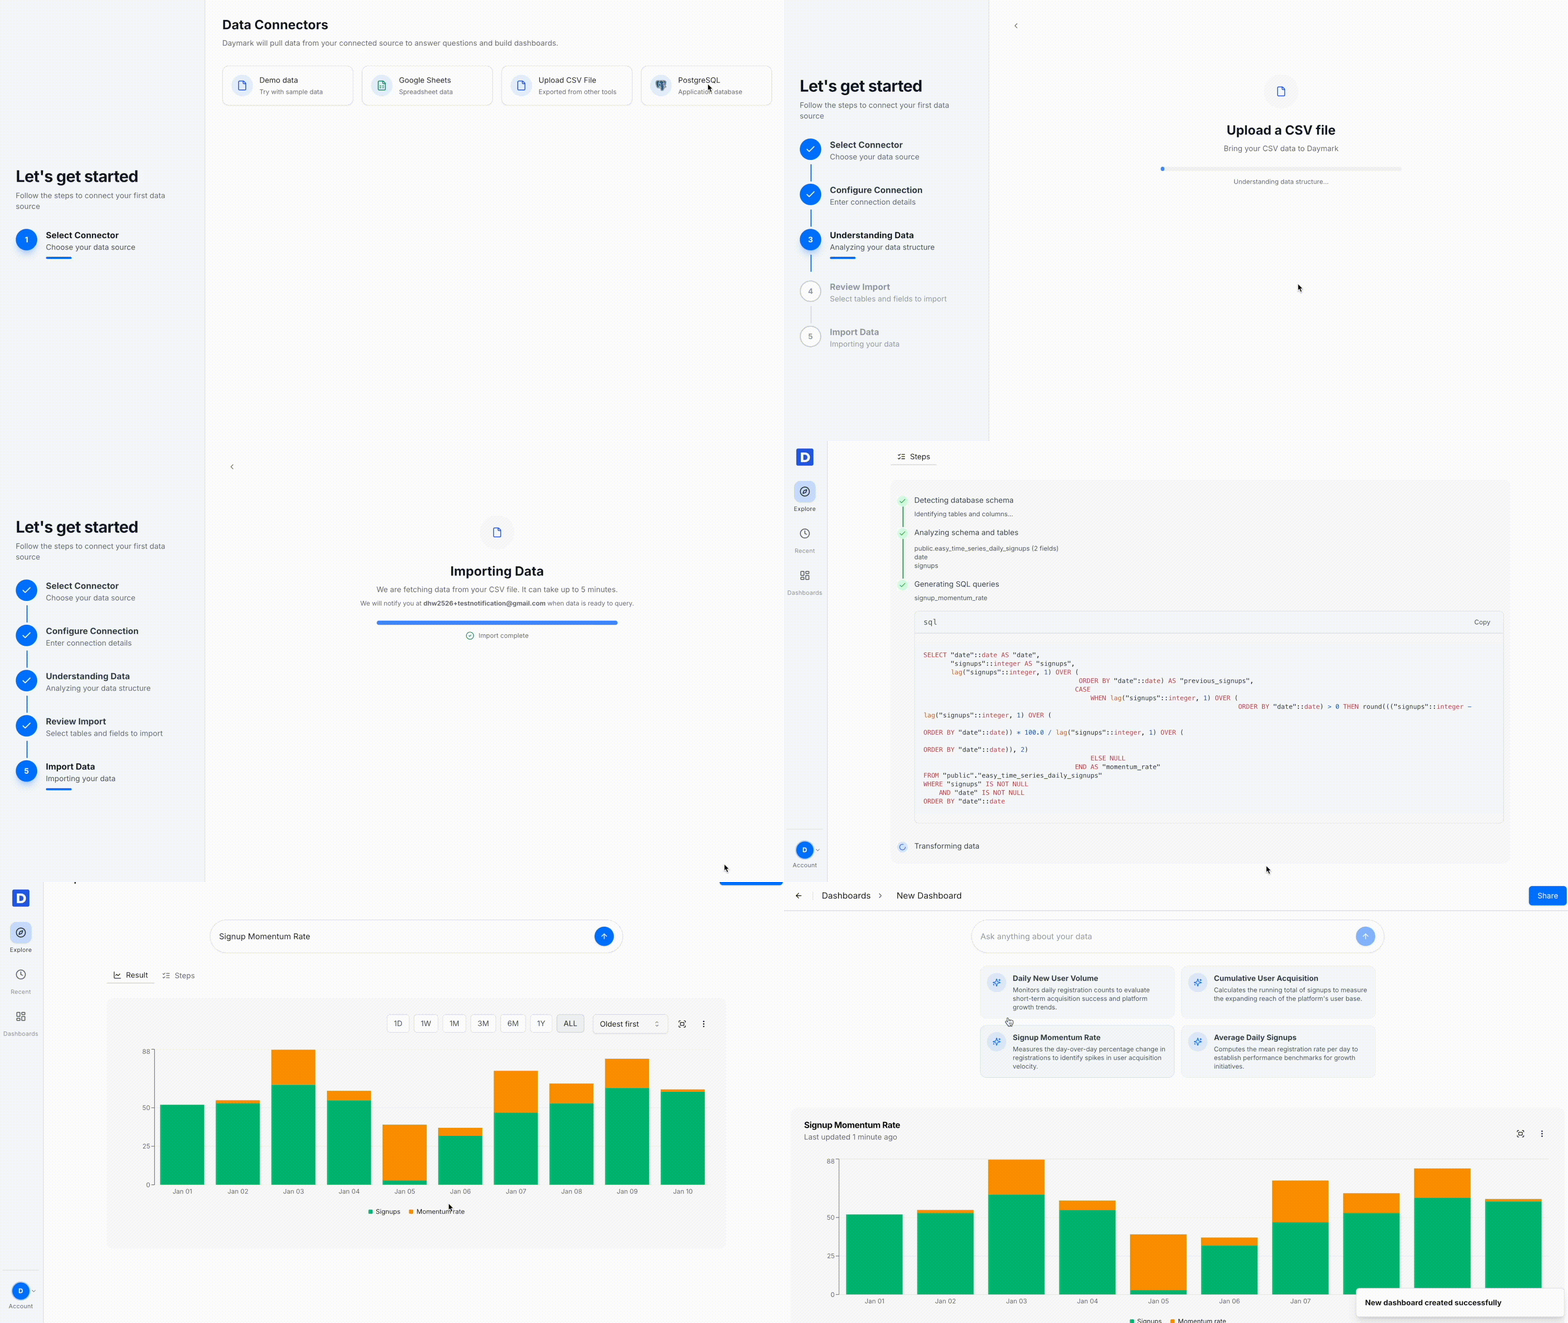 ## Quickstart: Create your first insight
### 1. Open Daymark and go to Explore
Log in to your Daymark workspace. The Explore page opens with a chatbox where you can ask questions and a visible **Add Data Source** button.
***
### 2. Connect your data
1. Click **Add Data Source** on the Explore page.
2. Choose where your data lives:
* **Google Sheets:** Authenticate and select the sheet or tab you want to analyze.
* **Upload CSV file:** Upload a CSV file directly.
* **PostgreSQL:** Enter your database connection details.
* **Demo sample data:** Use a sample dataset if you're just exploring Daymark.
3. Follow the prompts to complete the connection.
Once connected, Daymark indexes your data automatically so you can start asking questions immediately.
***
### 3. Ask a question in plain English
Type your question into the chat box as if you were talking to a teammate:
* “What were our total sales last month by region?”
* “Which product had the highest daily active users this quarter?”
* “Daily sign-ups vs conversions this month.”
You can also pick from the **suggested questions** in the chat. You don’t need to know table names or write SQL. Just describe what you want to understand.
***
### 4. Review and refine the visual answer
Daymark returns an answer as a **chart or table**, depending on your question:
* Bar charts for comparisons
* Line charts for trends over time
* Tables for detailed records
If the result isn’t exactly what you need, create a new query and ask the question again.
***
### 5. Add the insight to a dashboard
When you see an answer worth tracking:
1. Click the **⋮** menu on the top-right of the chart.
2. Select **Add to Dashboard**.
3. Choose to create a new dashboard or add it to an existing one.
***
### 6. Share and keep everyone aligned
Open the dashboard view and click **Share**. Enter your teammates’ email addresses to give them access.
They’ll receive a secure link and always see the latest version of the dashboard, powered directly by your data.
***
## What’s next
Learn how to add additional databases, Sheets, or CSV workflows.
Create a shareable dashboard that keeps your key metrics and charts in one place.
With your first insight live, keep iterating: ask the next question, add it to the same dashboard, and build a Product, Revenue, or Ops view grounded in real data.
## Quickstart: Create your first insight
### 1. Open Daymark and go to Explore
Log in to your Daymark workspace. The Explore page opens with a chatbox where you can ask questions and a visible **Add Data Source** button.
***
### 2. Connect your data
1. Click **Add Data Source** on the Explore page.
2. Choose where your data lives:
* **Google Sheets:** Authenticate and select the sheet or tab you want to analyze.
* **Upload CSV file:** Upload a CSV file directly.
* **PostgreSQL:** Enter your database connection details.
* **Demo sample data:** Use a sample dataset if you're just exploring Daymark.
3. Follow the prompts to complete the connection.
Once connected, Daymark indexes your data automatically so you can start asking questions immediately.
***
### 3. Ask a question in plain English
Type your question into the chat box as if you were talking to a teammate:
* “What were our total sales last month by region?”
* “Which product had the highest daily active users this quarter?”
* “Daily sign-ups vs conversions this month.”
You can also pick from the **suggested questions** in the chat. You don’t need to know table names or write SQL. Just describe what you want to understand.
***
### 4. Review and refine the visual answer
Daymark returns an answer as a **chart or table**, depending on your question:
* Bar charts for comparisons
* Line charts for trends over time
* Tables for detailed records
If the result isn’t exactly what you need, create a new query and ask the question again.
***
### 5. Add the insight to a dashboard
When you see an answer worth tracking:
1. Click the **⋮** menu on the top-right of the chart.
2. Select **Add to Dashboard**.
3. Choose to create a new dashboard or add it to an existing one.
***
### 6. Share and keep everyone aligned
Open the dashboard view and click **Share**. Enter your teammates’ email addresses to give them access.
They’ll receive a secure link and always see the latest version of the dashboard, powered directly by your data.
***
## What’s next
Learn how to add additional databases, Sheets, or CSV workflows.
Create a shareable dashboard that keeps your key metrics and charts in one place.
With your first insight live, keep iterating: ask the next question, add it to the same dashboard, and build a Product, Revenue, or Ops view grounded in real data.